
Resources & User Guide
The complete documentation for Alpha Crawler — the all-in-one technical SEO crawler and on-page analyzer, purpose-built and optimised for deep technical crawling of up to 10,000 pages per audit. Learn how to configure a crawl, read every report, fix the issues that matter most, validate your structured data, and export everything to CSV or XLSX. Each section below has a direct anchor link you can bookmark and share.
Quick Start: Running Your First Technical SEO Audit
Auditing a website takes three steps: enter the full URL (including https://) into the address bar at the top of the dashboard, optionally open Crawler Configuration to tune limits, then press Launch. The crawler discovers your sitemap, traverses the internal link graph, validates every response, and streams results into the dashboard in real time.
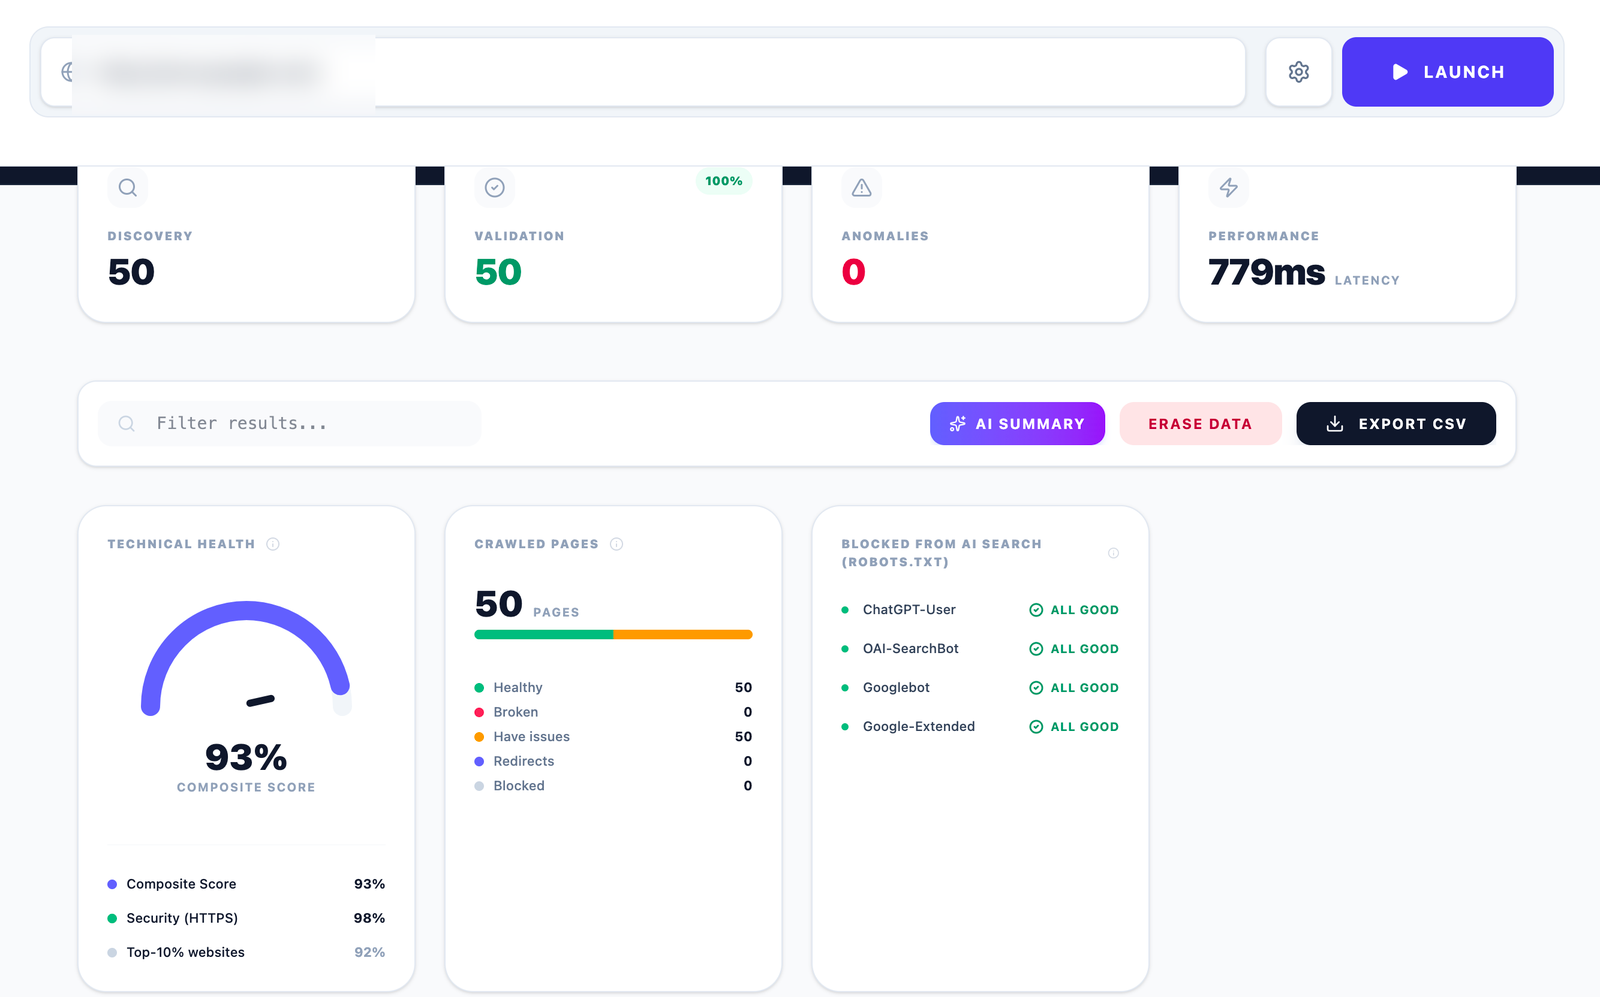
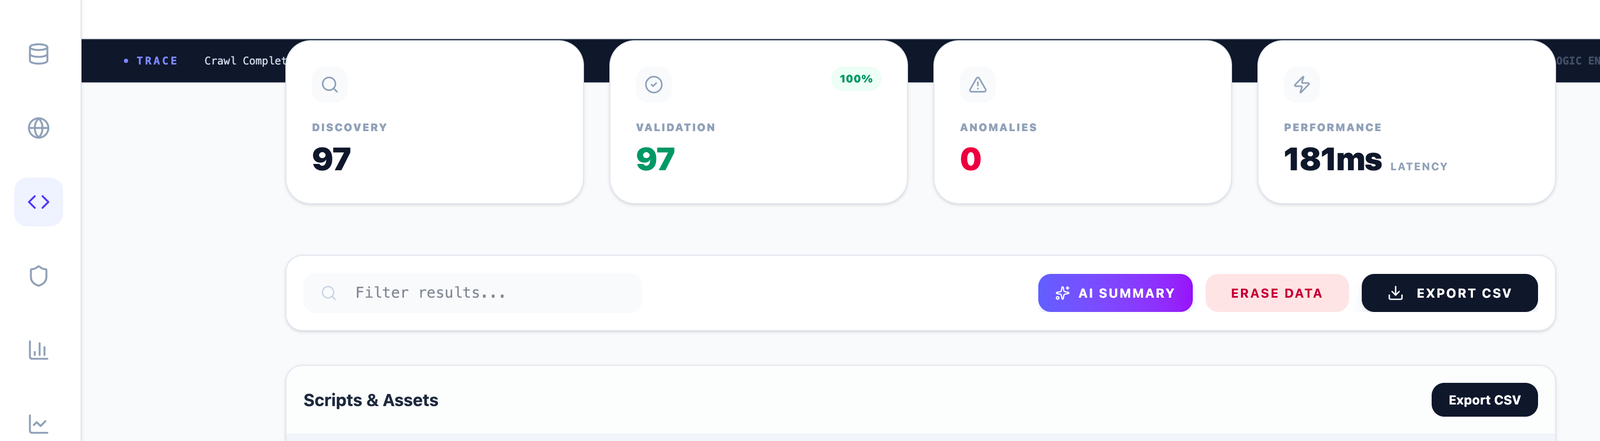
- Discovery & Validation: the top status cards show how many URLs were discovered, how many were successfully validated (with a live percentage), any anomalies encountered, and the average server latency in milliseconds.
- Crawl limits: the engine is optimised as a dedicated technical crawler and scales from quick 10-page spot checks to full 10,000-page deep audits. The crawler respects
robots.txtautomatically. - Wait times: deep scans of large domains take several minutes — every page is parsed for titles, meta tags, headings, scripts, structured data, HTTP headers and indexability signals.
- Session controls: use Erase Data to clear the current crawl, the filter box to narrow any table instantly, and the export buttons to download reports.
Crawler Configuration: Depth, Scope, Sitemaps & Rendering
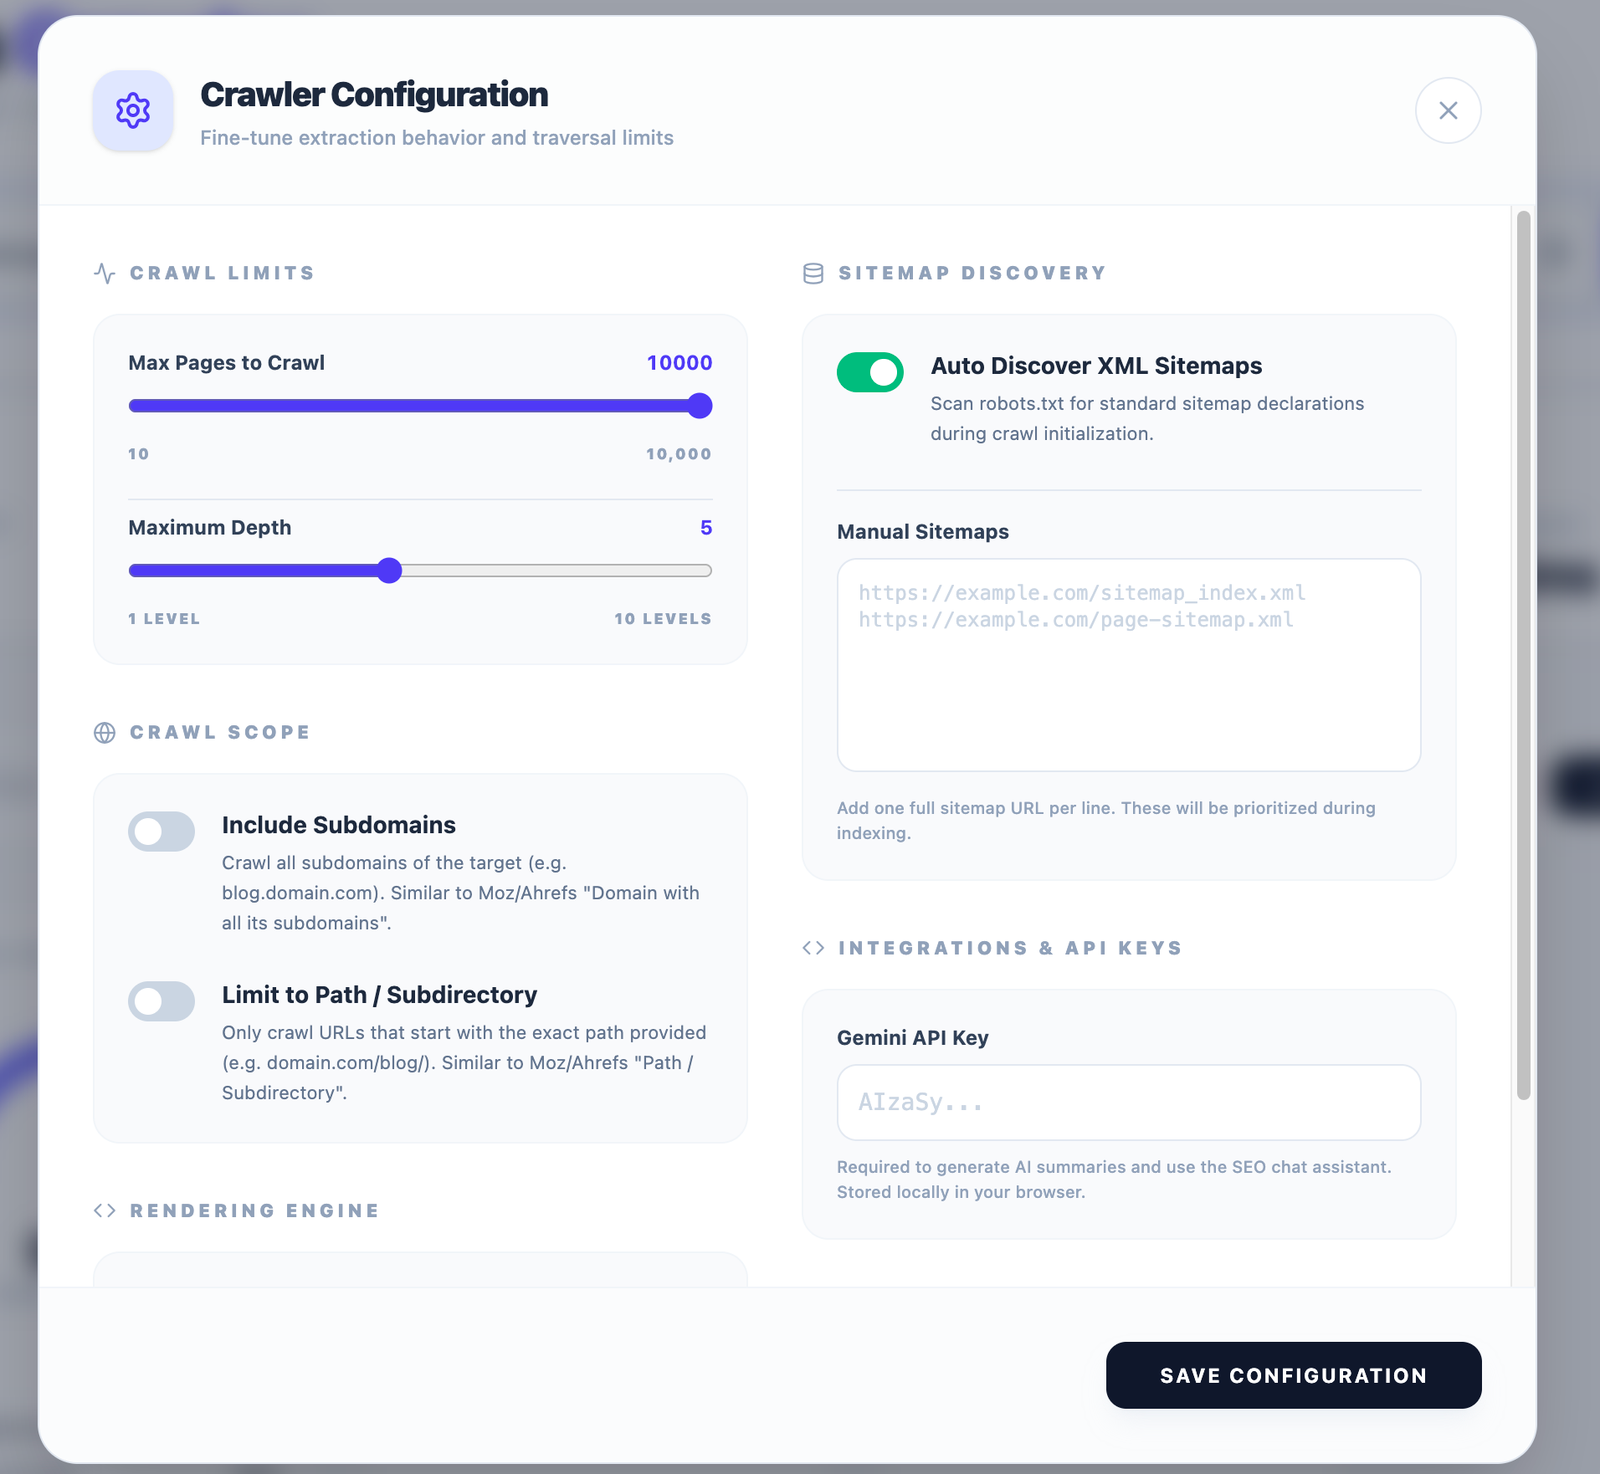
Before launching, click the gear icon next to the Launch button to fine-tune extraction behavior and traversal limits. Saved settings apply to every future crawl.
Crawl Limits
Max Pages to Crawl (10 – 10,000) caps the total URLs fetched. Maximum Depth (1 – 10 levels) controls how many clicks away from the start URL the crawler will travel.
Crawl Scope
Include Subdomains crawls the domain plus all its subdomains (e.g. blog.domain.com). Limit to Path / Subdirectory restricts the crawl to URLs starting with an exact path such as domain.com/blog/.
Sitemap Discovery
Auto Discover XML Sitemaps scans robots.txt for sitemap declarations during crawl initialization. Under Manual Sitemaps, add one full sitemap URL per line — these are prioritized during indexing.
Integrations & API Keys
Paste your Gemini API key to unlock AI summaries and the SEO chat assistant. The key is stored locally in your browser and never sent to our servers.
The Rendering Engine section controls how pages are fetched and parsed, so both server-rendered and JavaScript-heavy sites can be audited accurately. Click Save Configuration to apply.
Site Health Dashboard: Your Website Overview
As soon as a crawl completes, the main dashboard gives you a single-screen picture of your website's technical health:
- Technical Health gauge: a composite score (0–100%) combining on-page, performance and security signals, with sub-scores for HTTPS security and a benchmark against the top 10% of websites.
- Crawled Pages breakdown: every crawled URL classified as Healthy, Broken, Have Issues, Redirects or Blocked, with a colour-coded progress bar.
- Errors & Warnings trend: distribution charts of critical errors and warnings across the crawl so you can see whether problems cluster in one section of the site.
- Toolbar: filter results instantly, generate an AI Summary, erase crawl data, or export the report.
AI Search Visibility: Are AI Engines Allowed to See Your Site?
Modern search happens in AI assistants as much as in classic search engines. The Blocked from AI Search (robots.txt) panel parses your robots.txt and reports, bot by bot, whether the crawlers that power AI answers can access your site:
- ChatGPT-User — the agent used when ChatGPT browses on a user's behalf.
- OAI-SearchBot — OpenAI's search indexing crawler.
- Googlebot — Google's classic search crawler.
- Google-Extended — the token controlling use of your content in Google's AI models.
Each bot shows an All Good badge when allowed, or a warning when your robots.txt is silently blocking it — a common, invisible reason sites disappear from AI-generated answers.
Critical Diagnostics: Prioritized Issues, Ranked by Impact
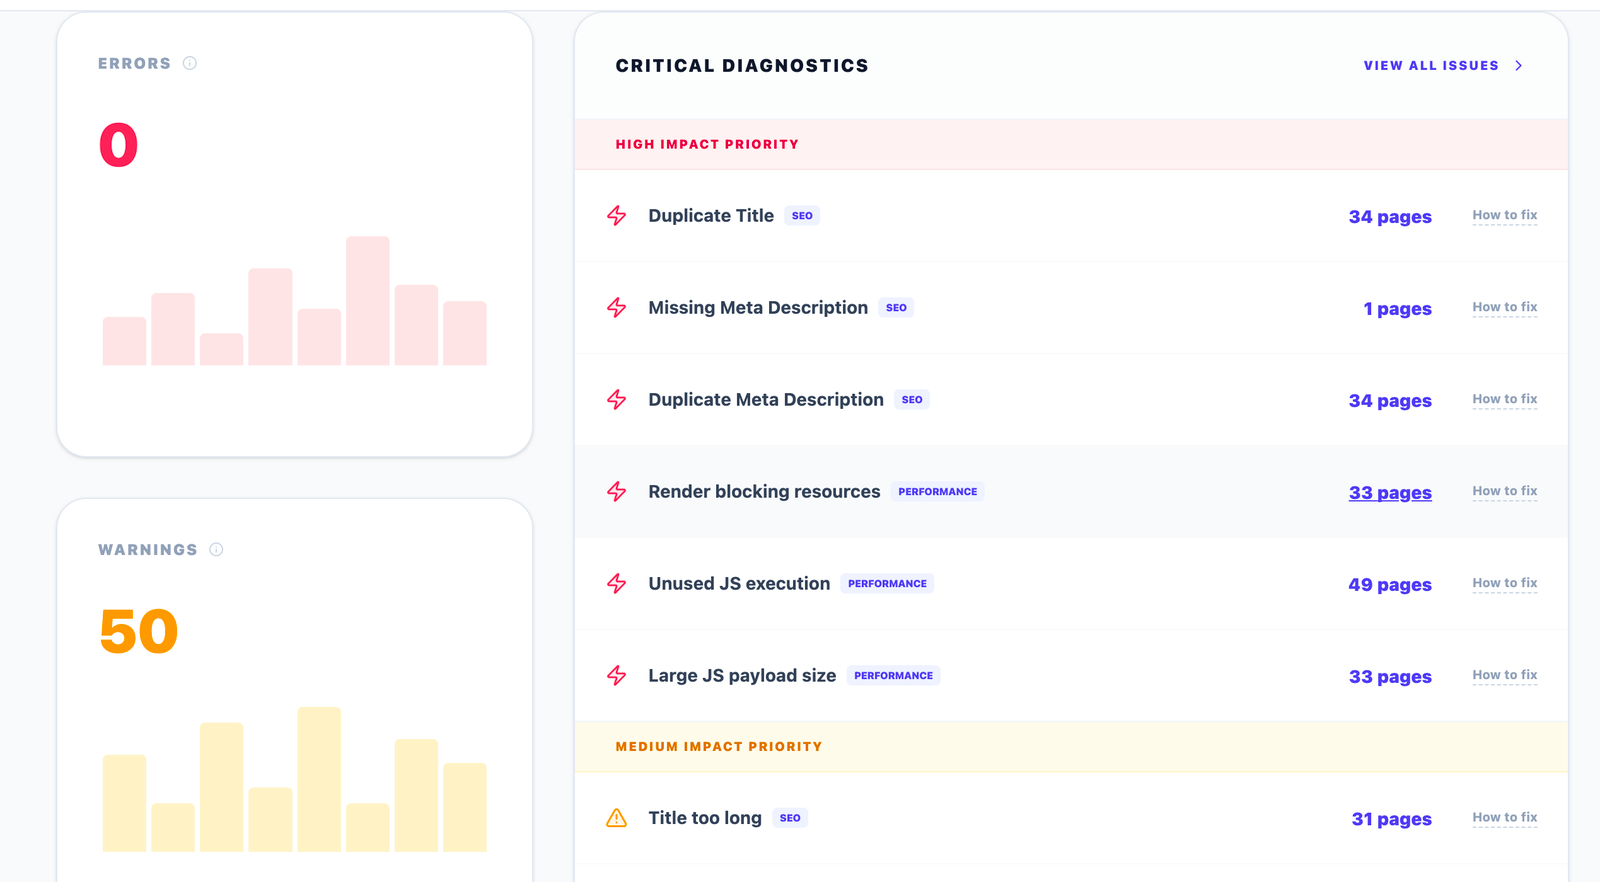
The Critical Diagnostics panel ranks every detected problem into High Impact and Medium Impact priority bands, each tagged as an SEO or Performance issue with the number of affected pages and a How to fix guide:
- SEO issues: duplicate titles, missing meta descriptions, duplicate meta descriptions, titles too long or too short.
- Performance issues: render-blocking resources, unused JavaScript execution, large JS payload sizes.
Click any page count to jump straight into the affected URLs, or View All Issues to open the full Diagnostic Issue Log.
Diagnostic Issue Log: Every On-Page & Technical Check
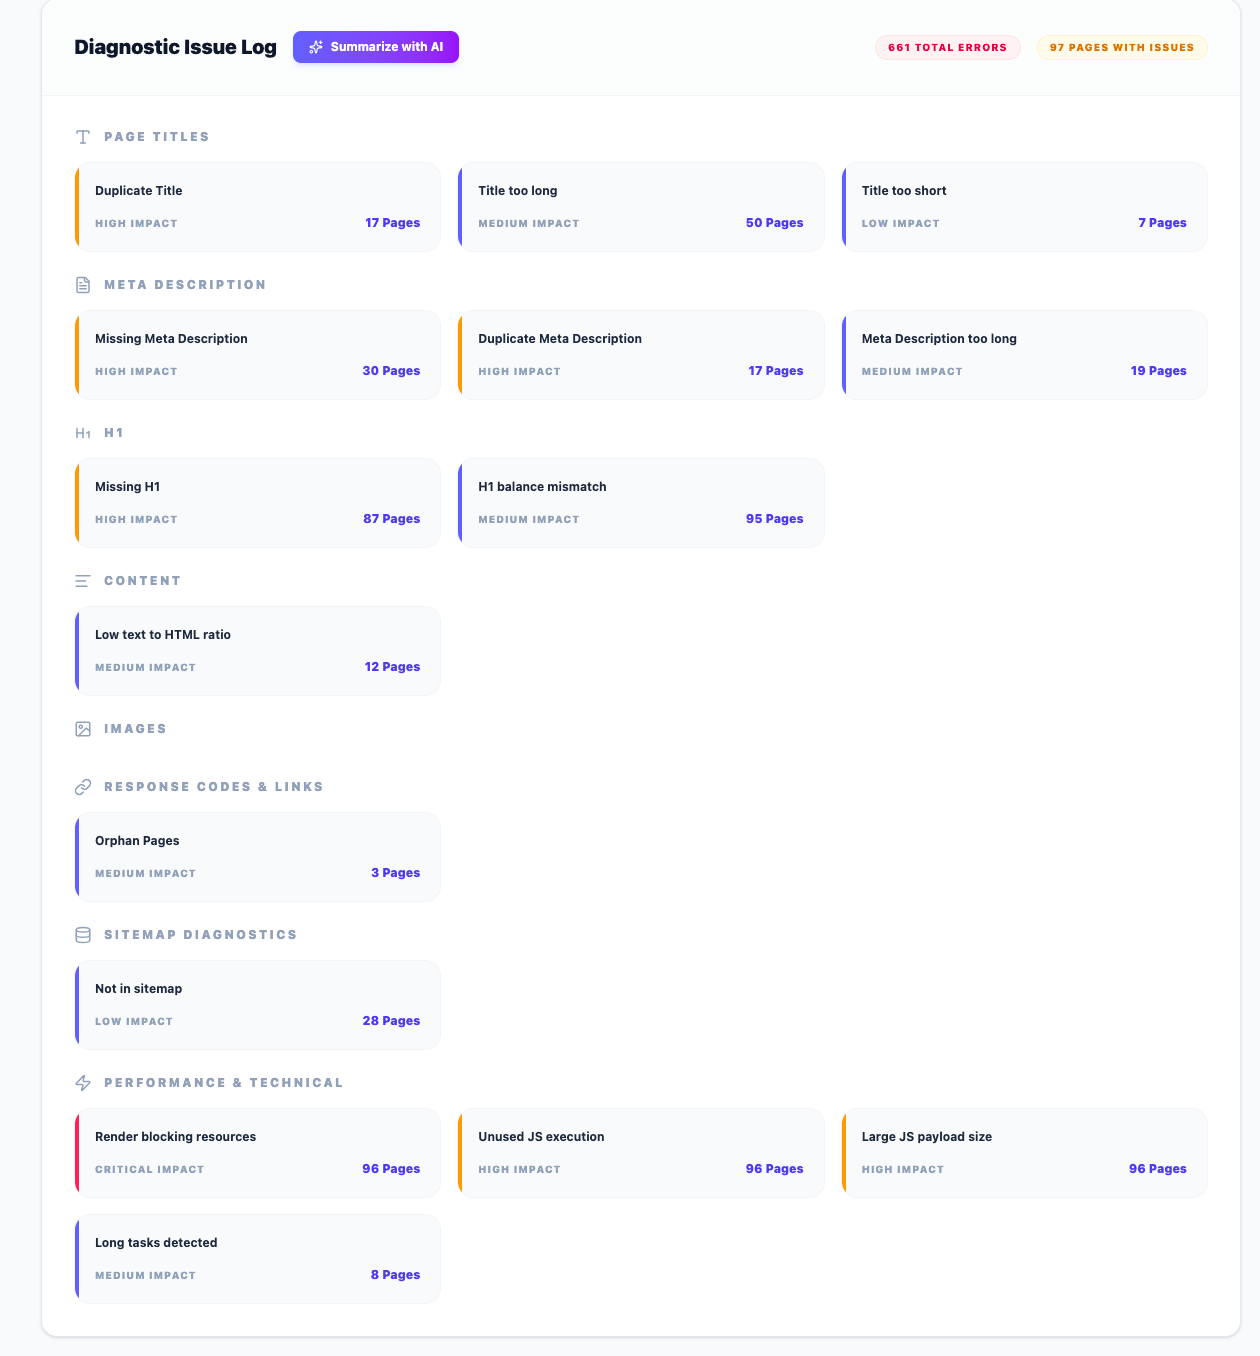
The Diagnostic Issue Log is the master audit view: a total error counter, a pages-with-issues counter, a one-click Summarize with AI button, and every check organized by category. Each issue card shows its impact level (Critical, High, Medium or Low) and how many pages are affected:
Page Titles
Duplicate Title, Title Too Long, Title Too Short — with pixel/character length validation.
Meta Descriptions
Missing Meta Description, Duplicate Meta Description, Meta Description Too Long.
Headings (H1)
Missing H1 and H1 Balance Mismatch (multiple or conflicting H1 tags on one page).
Content & Images
Low text-to-HTML ratio detection and image alt attribute integrity checks.
Response Codes & Links
Orphan Pages — URLs with no internal inbound links that users and crawlers can't reach through navigation.
Sitemap Diagnostics
Not in Sitemap — live pages missing from your XML sitemap, which slows their discovery and indexing.
Performance & Technical
Render-Blocking Resources (critical), Unused JS Execution across the website, Large JS Payload Size, and Long Tasks Detected on the main thread.
Page-Level Drill-Down: From Issue to URL to Fix
Alpha Crawler works in both directions — from issue to pages, and from page to issues:
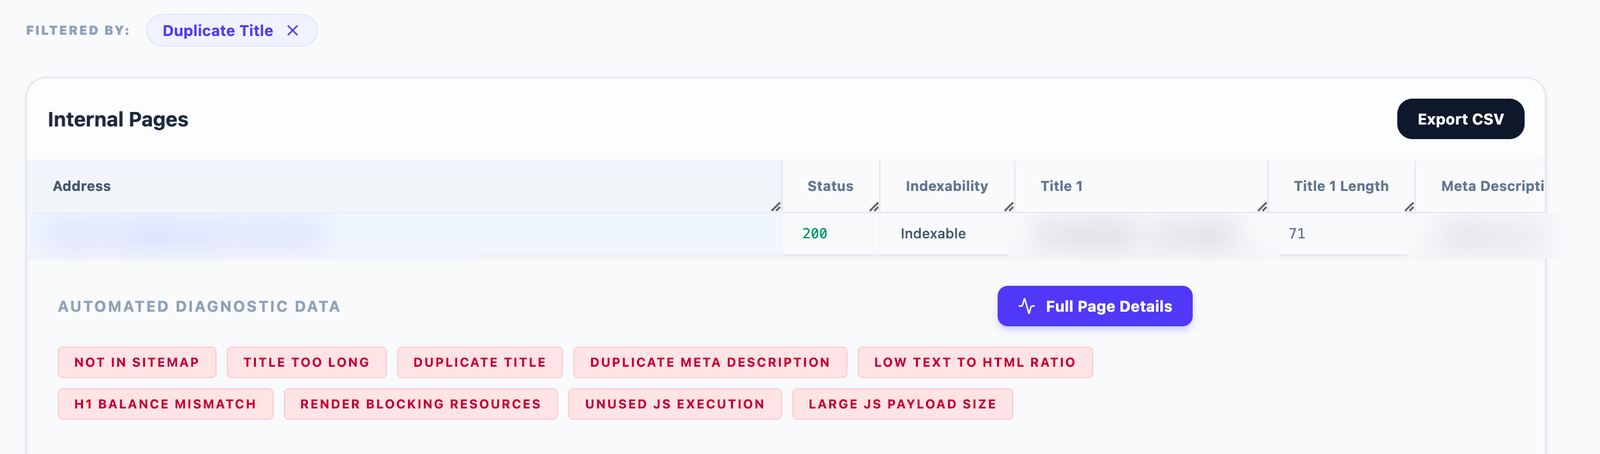
- Click an issue in the Issue Log and the Internal Pages table instantly filters to only the URLs affected, with a removable "Filtered by" chip at the top.
- Click a page and its Automated Diagnostic Data expands, listing every issue found on that page as red badges — for example Not in Sitemap, Title Too Long, Duplicate Meta Description, H1 Balance Mismatch, Render Blocking Resources, Unused JS Execution and Large JS Payload Size.
- Click Full Page Details to open the complete URL Diagnostic Insights report for that single URL.
URL Diagnostic Insights: The Full Anatomy of a Single Page
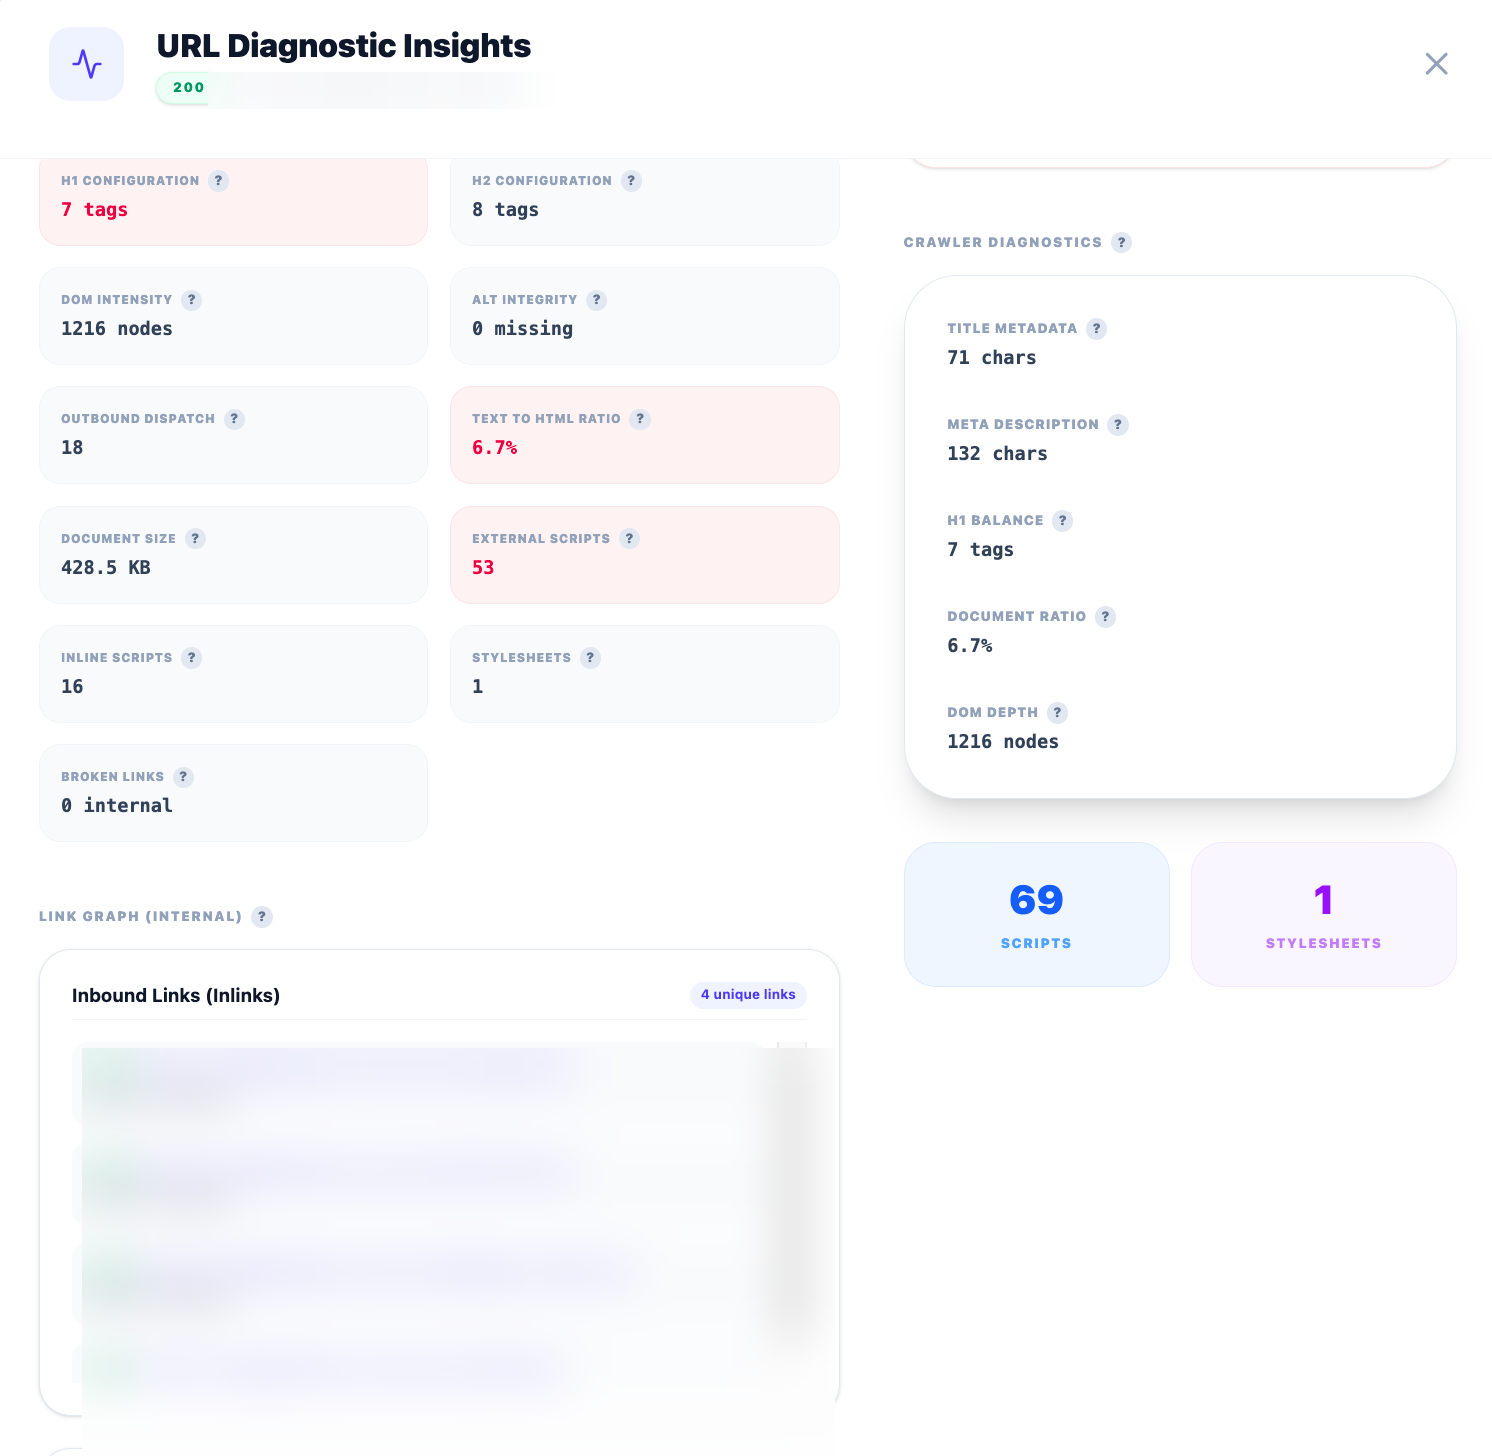
The Full Page Details view is a complete technical X-ray of one URL, organized into four zones:
On-Page Metrics
H1 and H2 tag counts, DOM intensity (total nodes), image alt integrity, outbound dispatch count, text-to-HTML ratio, document size, external and inline script counts, stylesheet count, and broken internal links — problem values are highlighted in red.
Crawler Diagnostics Summary
Title metadata length in characters, meta description length, H1 balance, document ratio and DOM depth — the exact numbers a search crawler evaluates.
Internal Link Graph
Inbound Links (Inlinks) and Outbound Links (Outlinks) with unique-link counters — every link shown with its HTTP status code and anchor text, so weak anchors and broken references are obvious.
Asset Execution Lifecycle
DOM Buffer, JS Runtime, CSS Object Model and Asset Fetching phases, each rated Healthy or Optimized with millisecond timings — a render-pipeline view of real page performance.
A fifth zone — the Structured Schema Engine — validates the page's structured data and is covered in Schema Analysis.
Site Architecture: Directory List & Visual Site Tree
Understand how your website is structured — and how deep your content is buried — with two complementary views:
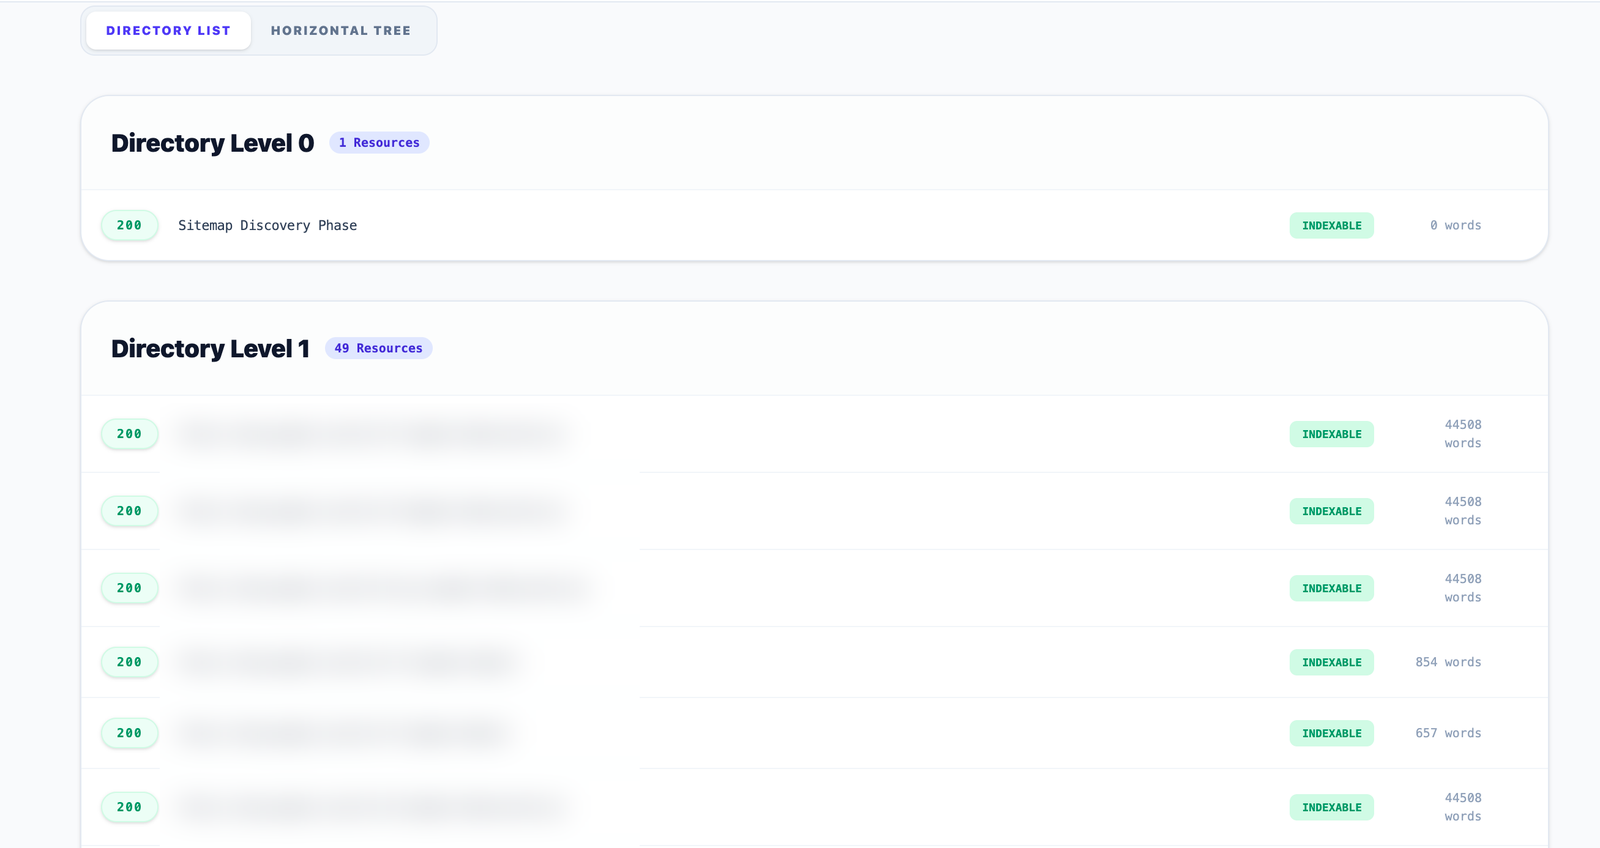
- Directory List: every crawled URL grouped by directory level (Level 0, Level 1, Level 2…), each row showing the HTTP status code, full URL, indexability badge and word count. Click any page to jump into its page-level diagnostics.
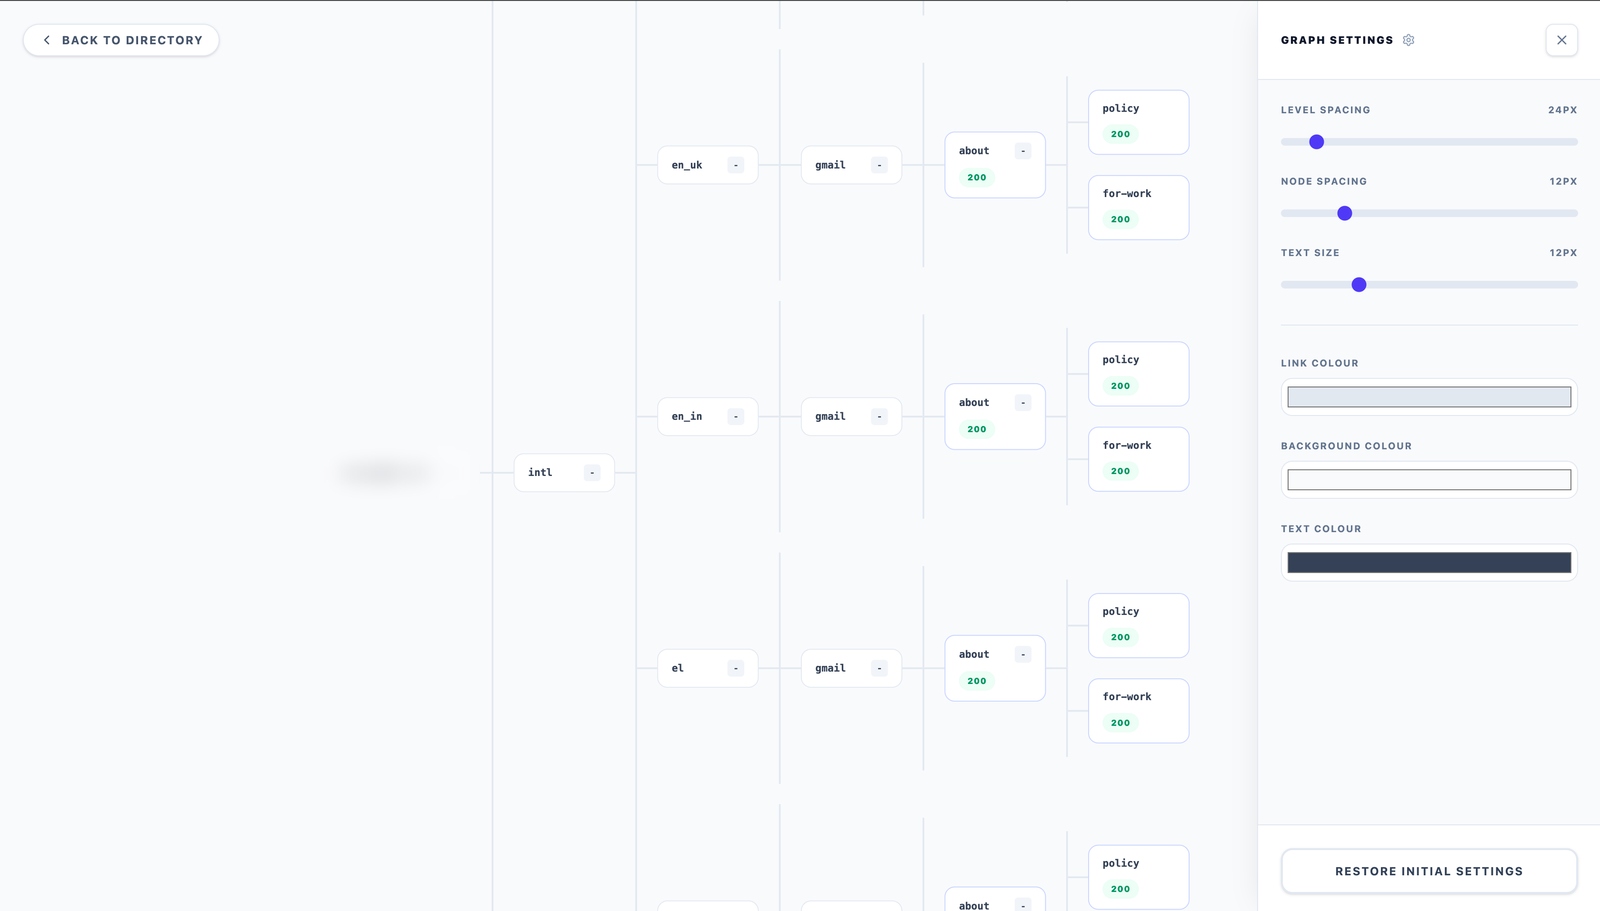
- Horizontal Tree: an interactive node graph of the entire site — domain → folders → pages — with the status code on every node. Pan and zoom freely, and use Graph Settings to adjust level spacing, node spacing, text size and link/background/text colours, or restore initial settings with one click.
Internal Pages: The Complete Crawl Inventory
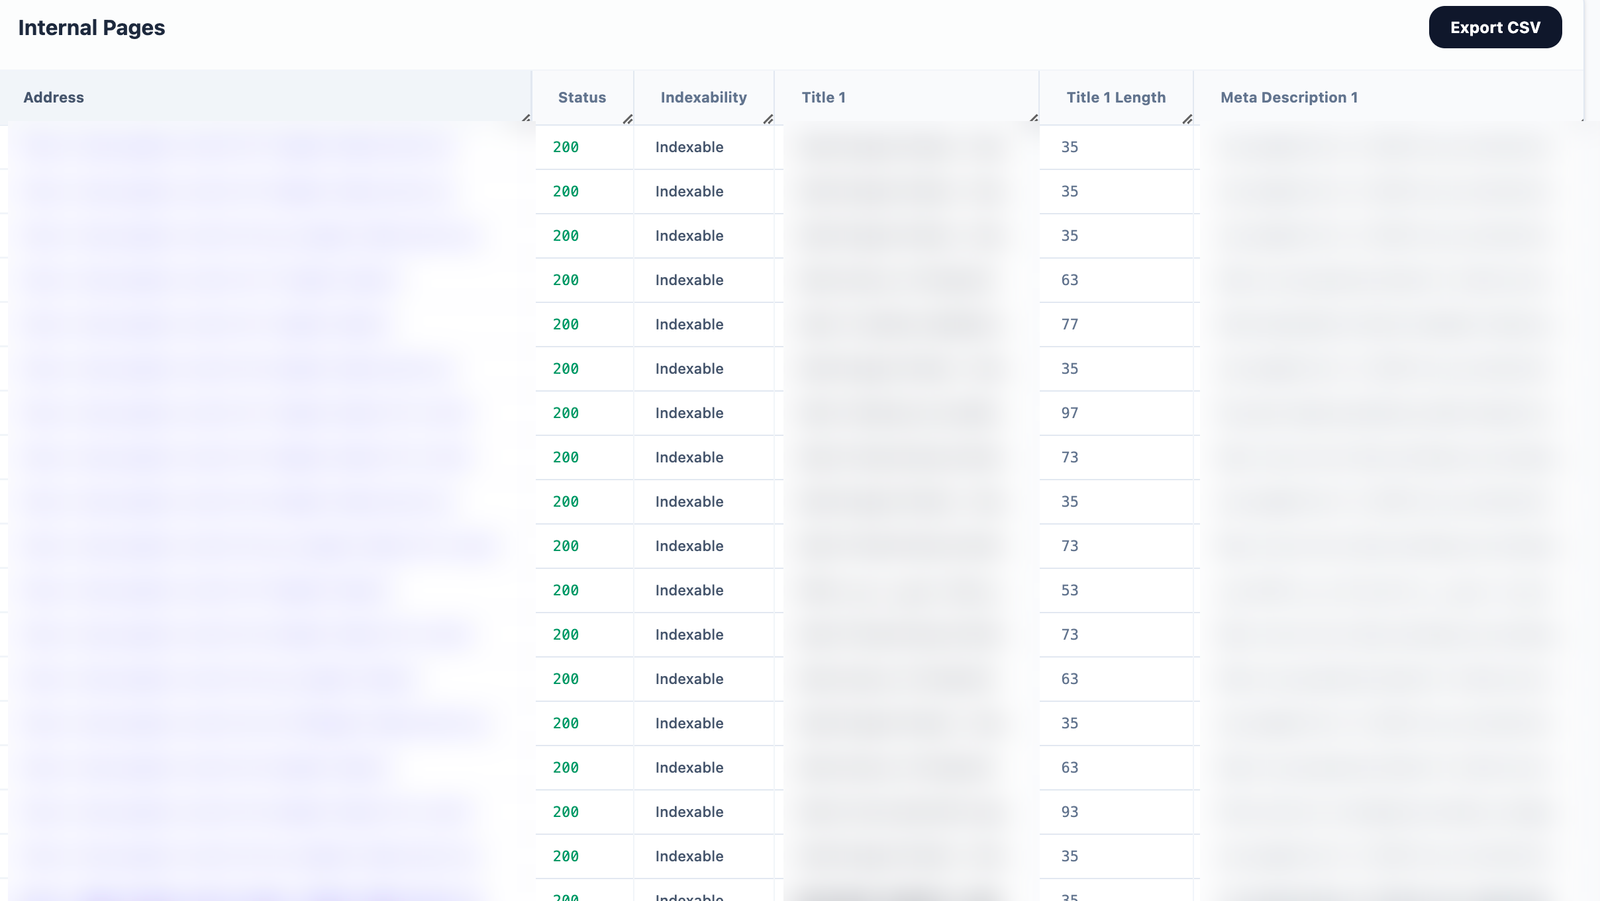
The Internal Pages table is the full inventory of every HTML page discovered in the crawl, in one sortable, filterable, exportable grid. Columns include:
- Address & Status: the full URL with its HTTP response code and indexability verdict.
- Metadata: Title 1 with title length, Meta Description 1 with description length, and H1 with H1 length — spot truncation and duplication instantly.
- Content signals: word count and text-to-HTML ratio per page.
- Link equity: inlinks and outlinks counts for every URL.
- Speed: per-page response time (load time) in milliseconds.
Columns are resizable, the filter box narrows the table live, and the whole grid exports to CSV or XLSX.
Scripts & Assets: Audit Every JS, CSS and Image
Beyond HTML pages, the crawler inventories every supporting resource your website loads — JavaScript files, stylesheets, images and other assets — each listed with its own HTTP status code, so broken scripts, missing images and dead CSS references surface immediately instead of silently degrading pages.
- Filter assets instantly and export the full inventory for your dev team.
- Combine with the Unused JS Execution check to find scripts loaded across the site that never run.
- The same Discovery / Validation / Anomalies / Latency status cards track the asset crawl in real time.
Comprehensive Crawler Analytics: Structure & Health Statistics
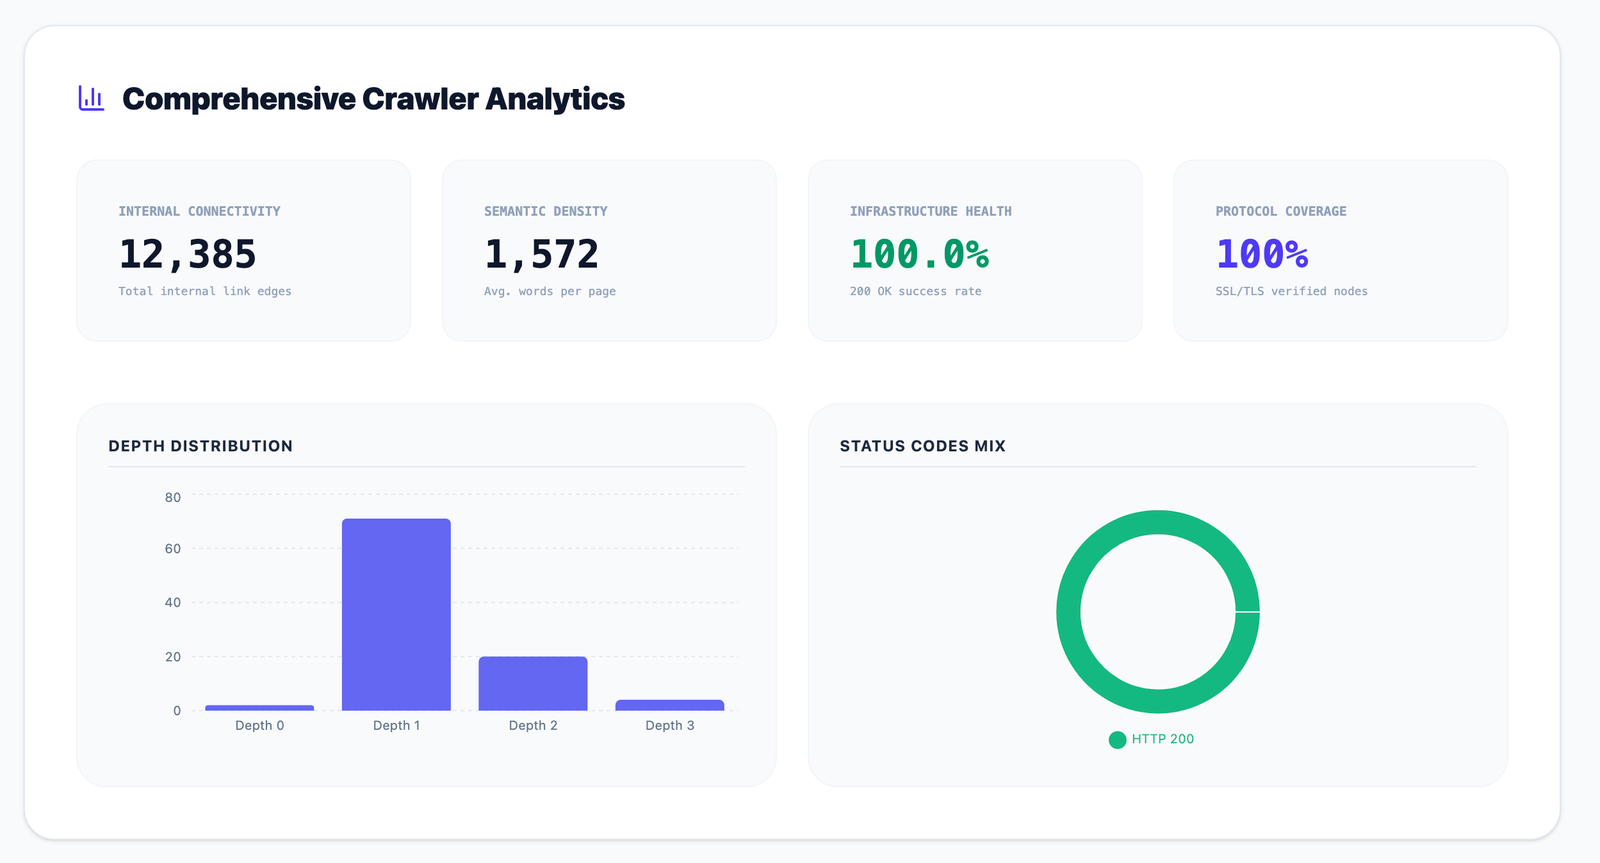
The Analytics view condenses the whole crawl into site-wide statistics:
- Internal Connectivity: total internal link edges — the strength of your internal linking graph.
- Semantic Density: average words per page across the site.
- Infrastructure Health: the 200 OK success rate across all requests.
- Protocol Coverage: percentage of SSL/TLS-verified nodes.
- Depth Distribution: a bar chart of how many pages sit at crawl depth 0, 1, 2, 3… — deep-buried content is harder for users and crawlers to reach.
- Status Codes Mix: a donut chart of every HTTP status code returned across pages and internal assets.
Schema Analysis: Site-Level Distribution & Page-Level Validation
Structured data powers rich results and helps AI engines understand your content. Alpha Crawler analyzes schema markup at two levels:
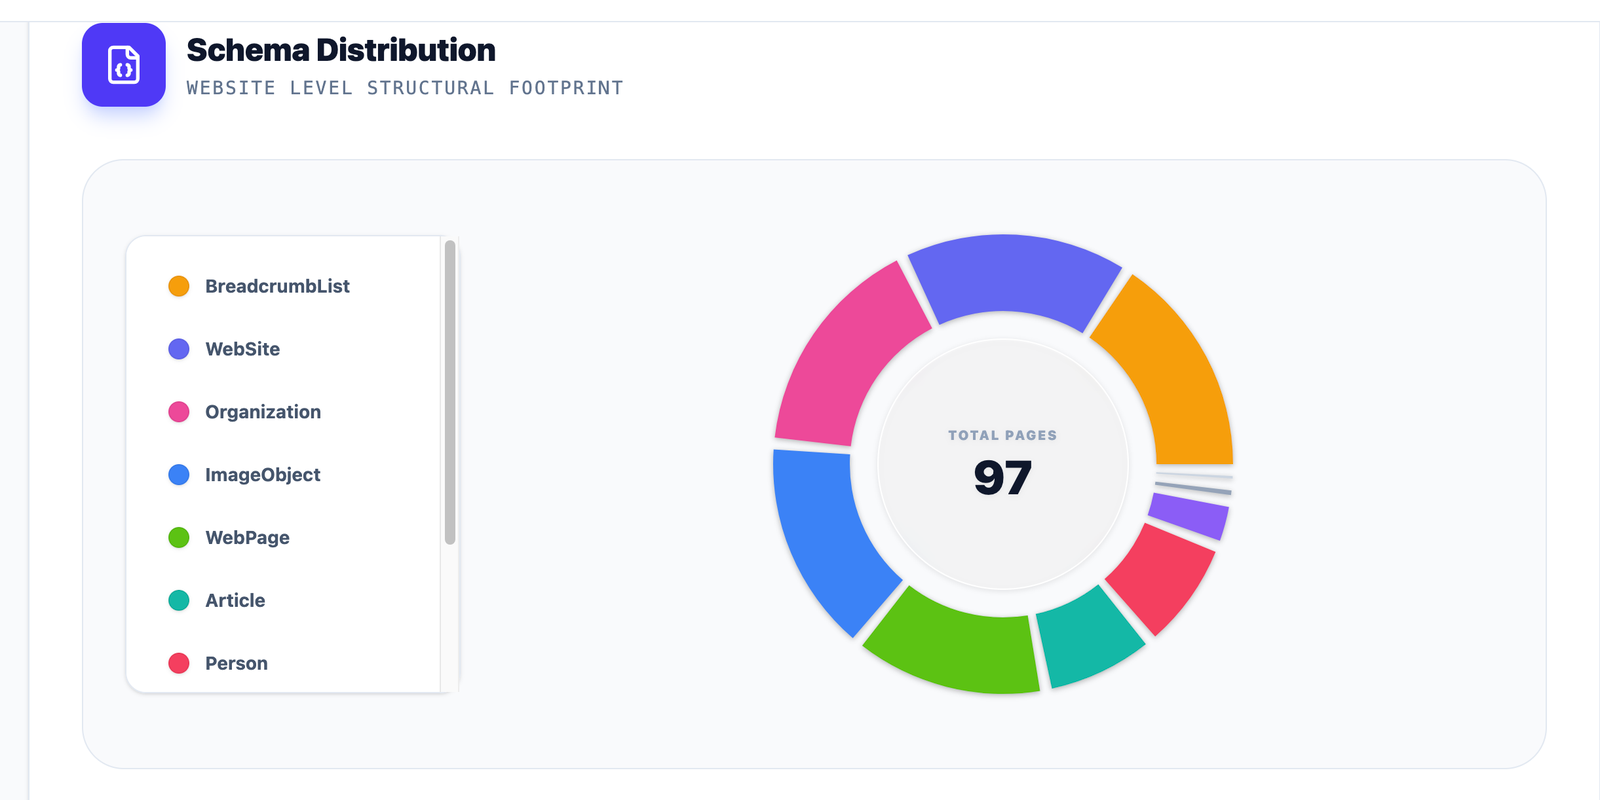
- Site-level Schema Distribution: a website-wide structural footprint — a donut chart of every schema type detected across all pages (WebPage, WebSite, Organization, BreadcrumbList, ImageObject, Article, Person, CollectionPage and more) with the total analyzed page count.
- Page-level schema list: under All Analyzed HTML Pages, filter by URL and see badges of every schema type implemented on each individual page — instantly spot pages missing Article or Breadcrumb markup.
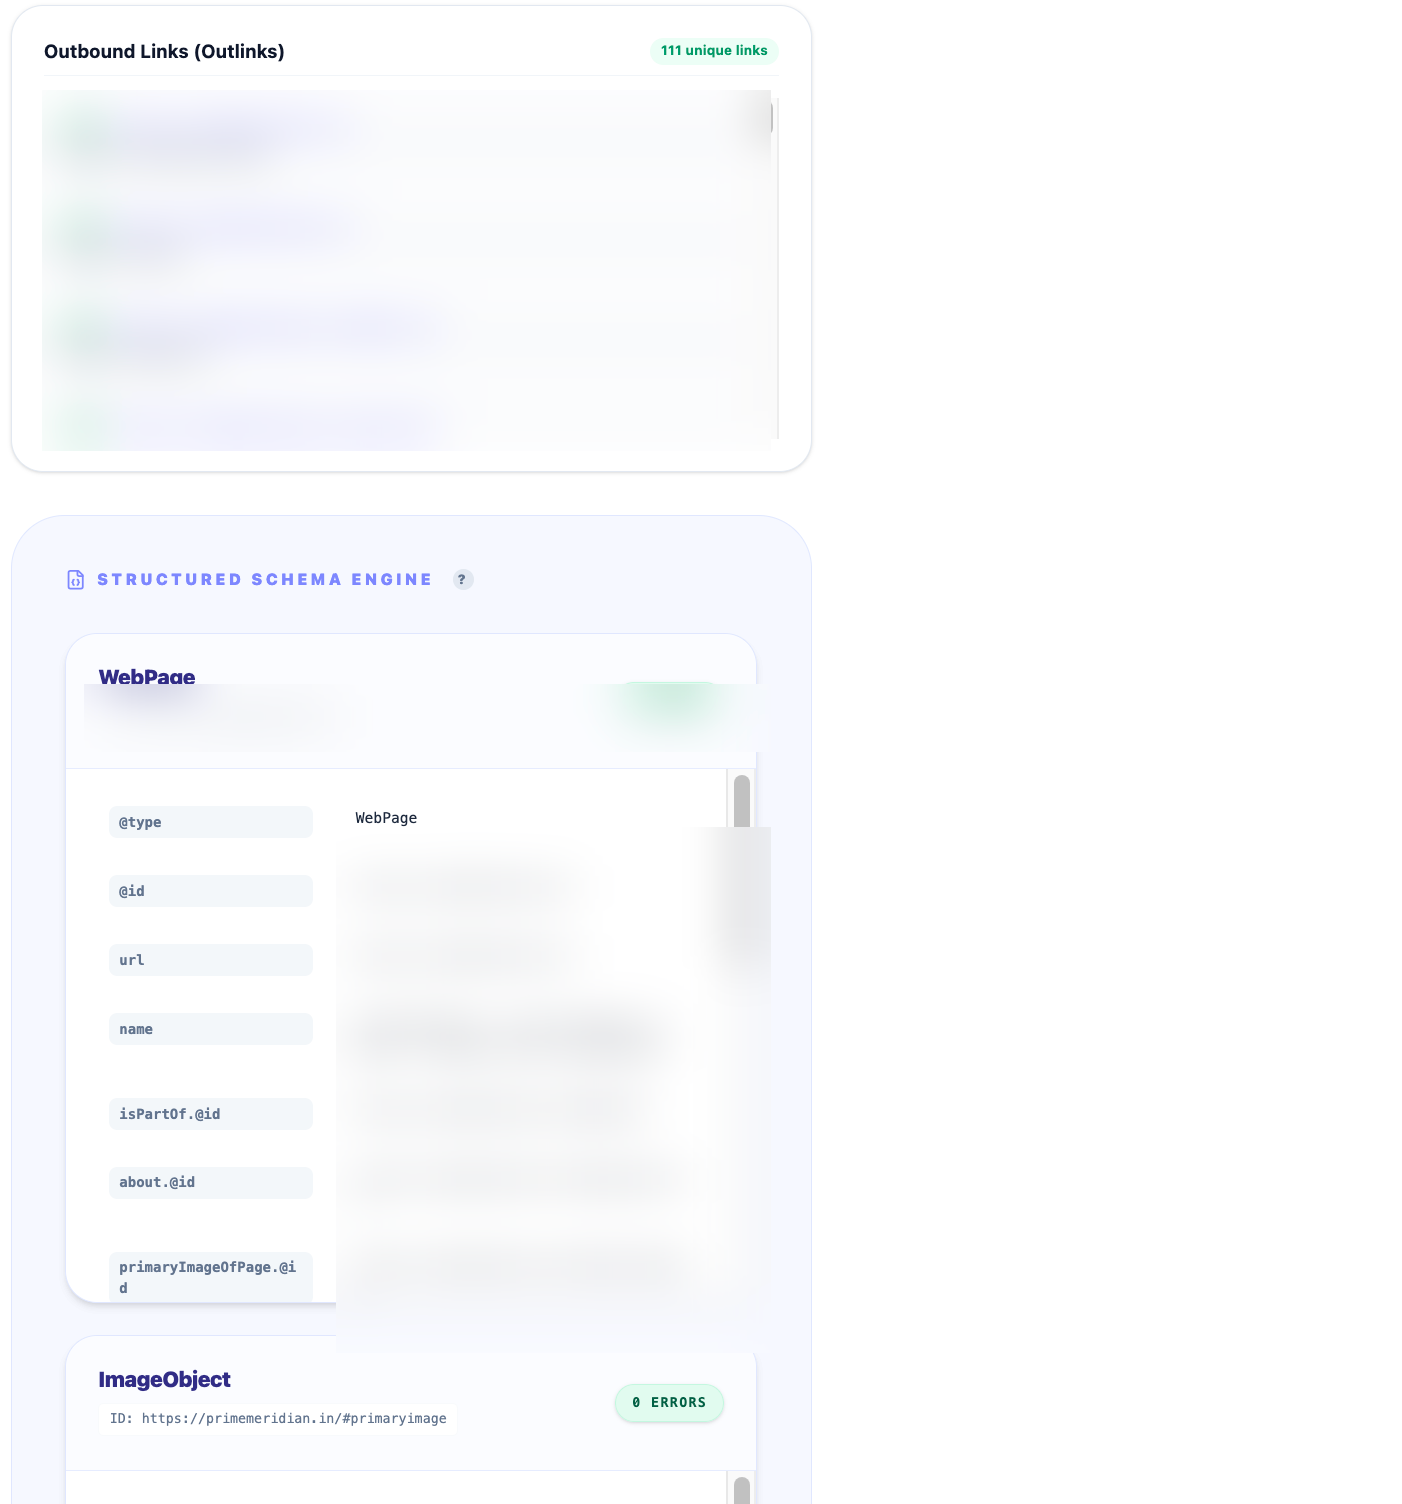
- Structured Schema Engine (per URL): inside Full Page Details, every JSON-LD entity on the page is expanded property by property — @type, @id, url, name, publisher, itemListElement and the rest — with an error counter per entity, so you validate your markup exactly as a search engine parses it.
Source Code Distribution: Your Website's Asset Footprint
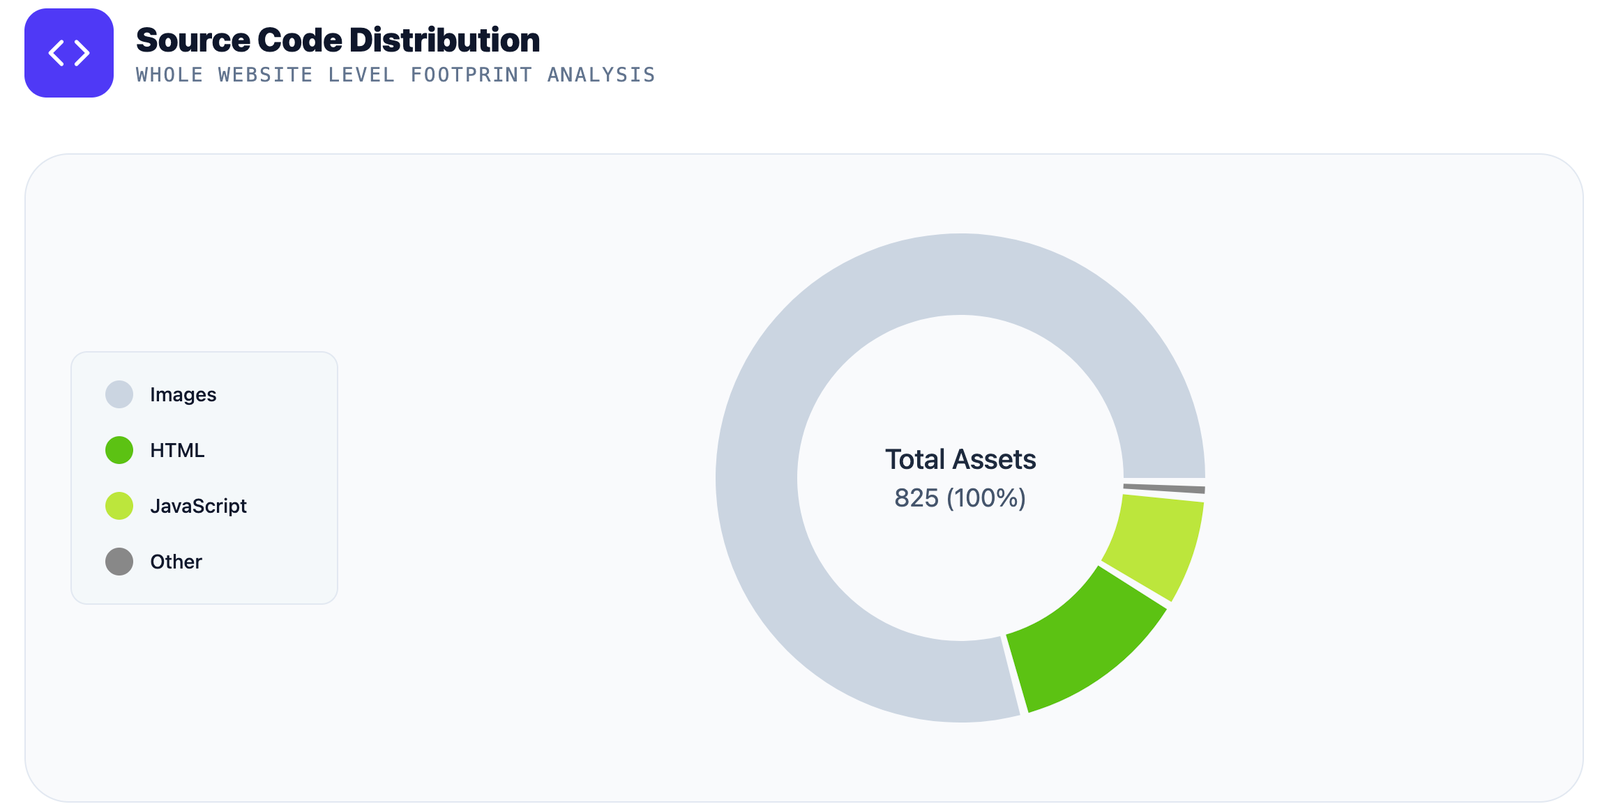
The Source Code Distribution report is a whole-website footprint analysis: a donut chart of the total asset count broken down by type — HTML, CSS, JavaScript, Images and Other — with the overall total in the center.
An image-heavy or JS-heavy footprint is an early warning for page-weight and Core Web Vitals problems; pair this chart with the Large JS Payload and Scripts & Assets reports to find exactly which files to optimize.
AI-Powered Insights on Every Report
Every report view in Alpha Crawler includes an AI Summary — the dashboard, Critical Diagnostics, the Diagnostic Issue Log ("Summarize with AI"), Internal Pages, Scripts & Assets, Crawler Analytics and Schema Analysis. The single exception is the visual Site Tree, which is a pure interactive visualization.
- AI summaries convert raw crawl data into a plain-language, prioritized action plan: what's broken, why it matters, and what to fix first.
- Powered by your own Gemini API key, entered once in Crawler Configuration and stored locally in your browser.
- Summaries are generated on demand — nothing is sent to the AI until you click the button.
Data Exports: Every Report in CSV & XLSX
Every report page can be exported in both CSV and XLSX (Excel) format using the export button on each panel — Internal Pages, Scripts & Assets, the Diagnostic Issue Log, filtered issue views, analytics and schema reports.
- Exports respect the current filter — filter to one issue, export only those URLs.
- CSV imports cleanly into any spreadsheet, BI tool or data pipeline; XLSX opens ready-formatted in Excel and Google Sheets.
- Hand a filtered export to a developer as a ready-made fix list, or archive full crawls for before/after comparisons.
Google Search Console Integration: Clicks, Impressions & Rankings
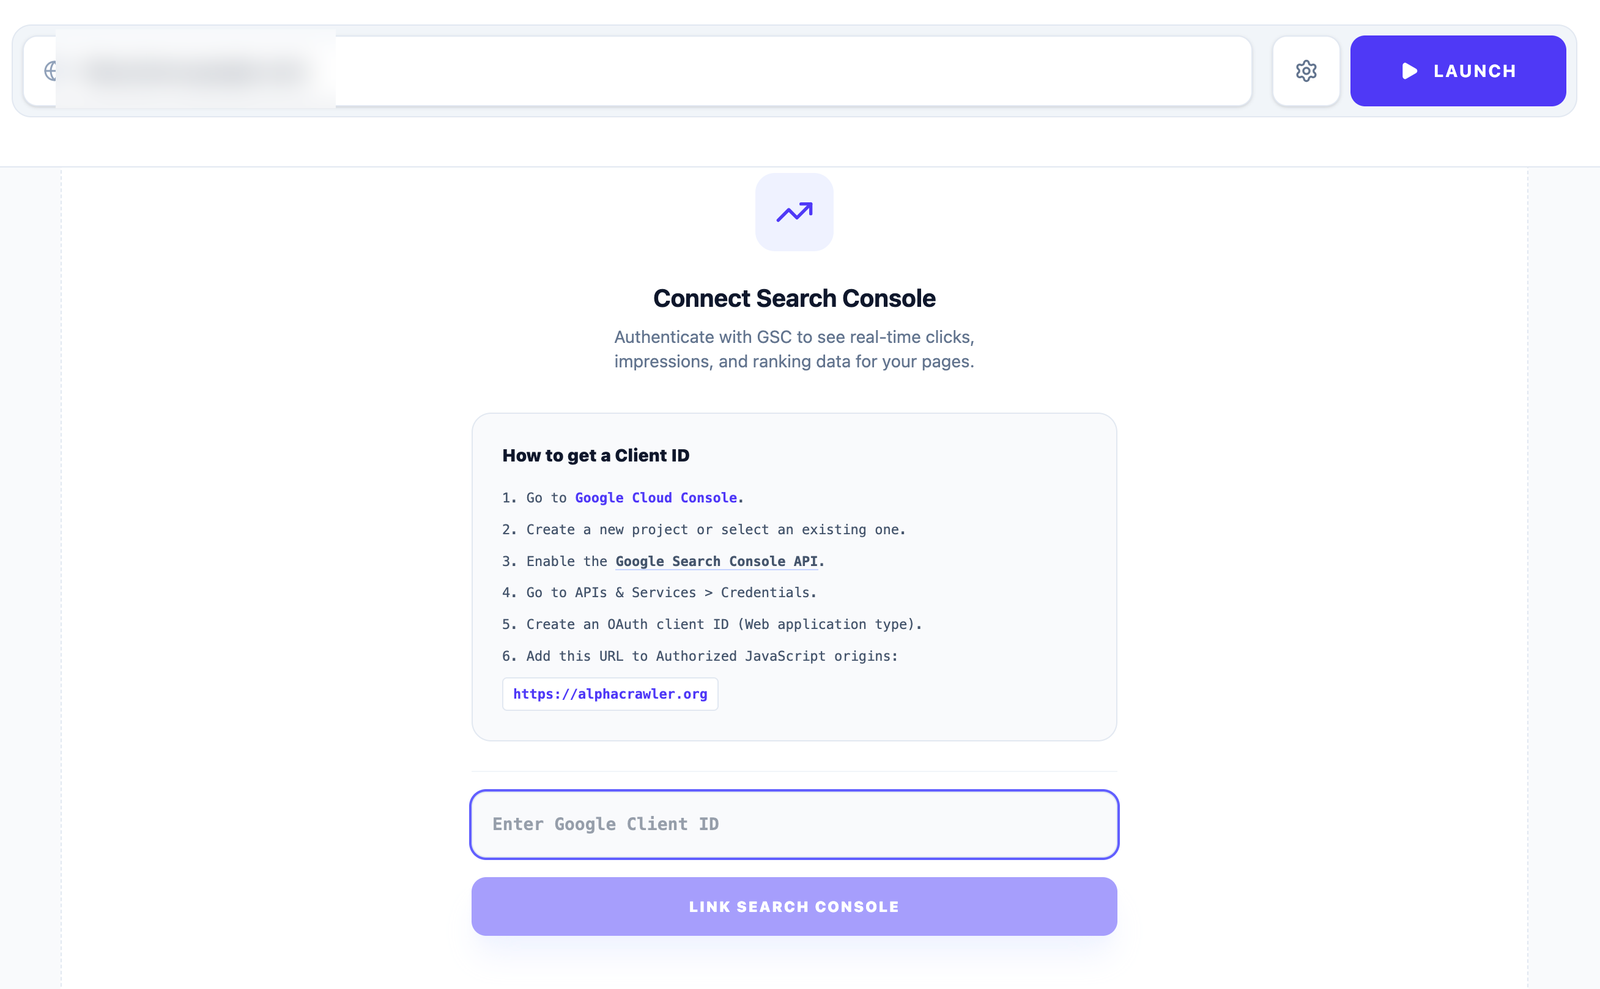
Connect Google Search Console to enrich your crawl with real-world search performance — clicks, impressions and ranking data for every page. Setup takes one OAuth Client ID:
- Go to Google Cloud Console and create a new project (or select an existing one).
- Enable the Google Search Console API.
- Open APIs & Services → Credentials and create an OAuth Client ID (Web application type).
- Add
https://alphacrawler.orgto Authorized JavaScript origins. - Paste the Client ID into the Connect Search Console screen and click Link Search Console, then authenticate with the Google account that owns the GSC property.
Data syncs into your session only — a one-time analysis leaves no persistent background sync. If you host your own instance, ensure VITE_GOOGLE_CLIENT_ID is configured.
Privacy & Independent Access
Isolated Environment
This tool is designed to run in complete isolation. When exported to any static/Node.js host:
No Tracking
No hidden telemetry or third-party tracking scripts are embedded.
Private AI Context
The Gemini API only receives your site crawl metrics, never your personal identity. Your API key is stored locally in your browser.